Tutorial
Run Detail Deep Dive
Inspect Overview, Routing, Steps, Context, Integrity, and Raw JSON for a single run.
1
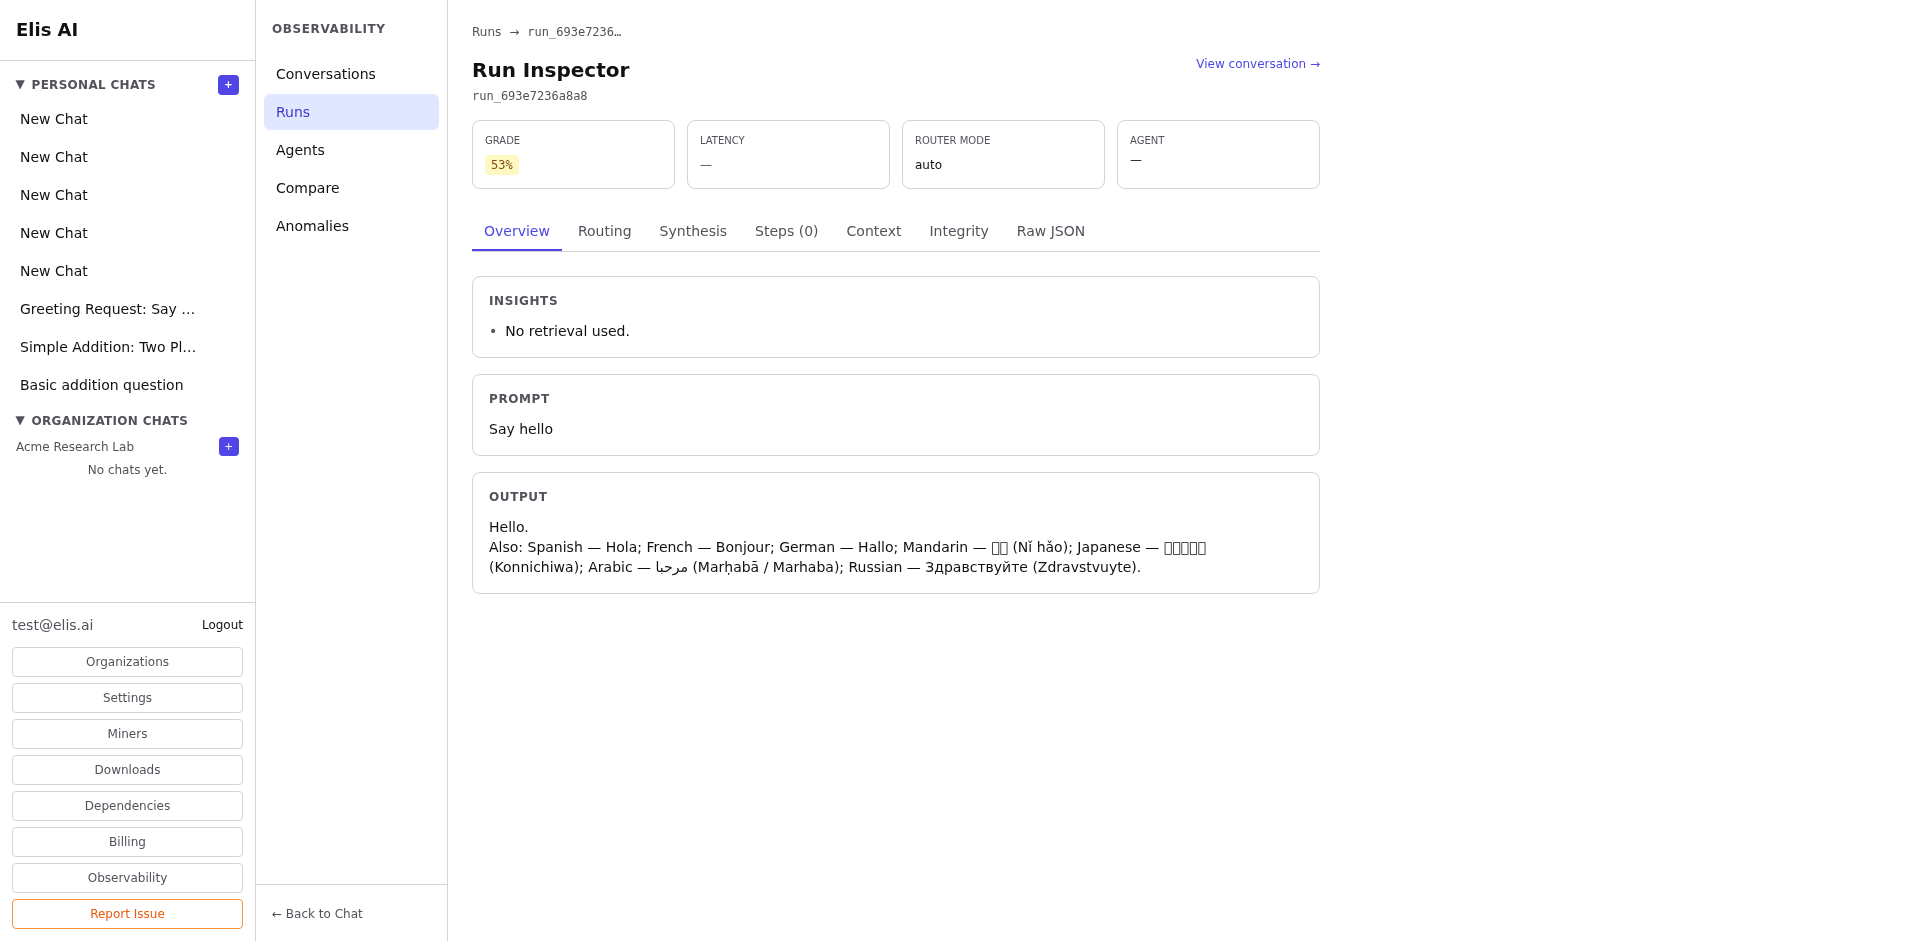
Click into a run
From the Runs dashboard, click any run ID to open its detail view. You'll land on the Overview tab.
2
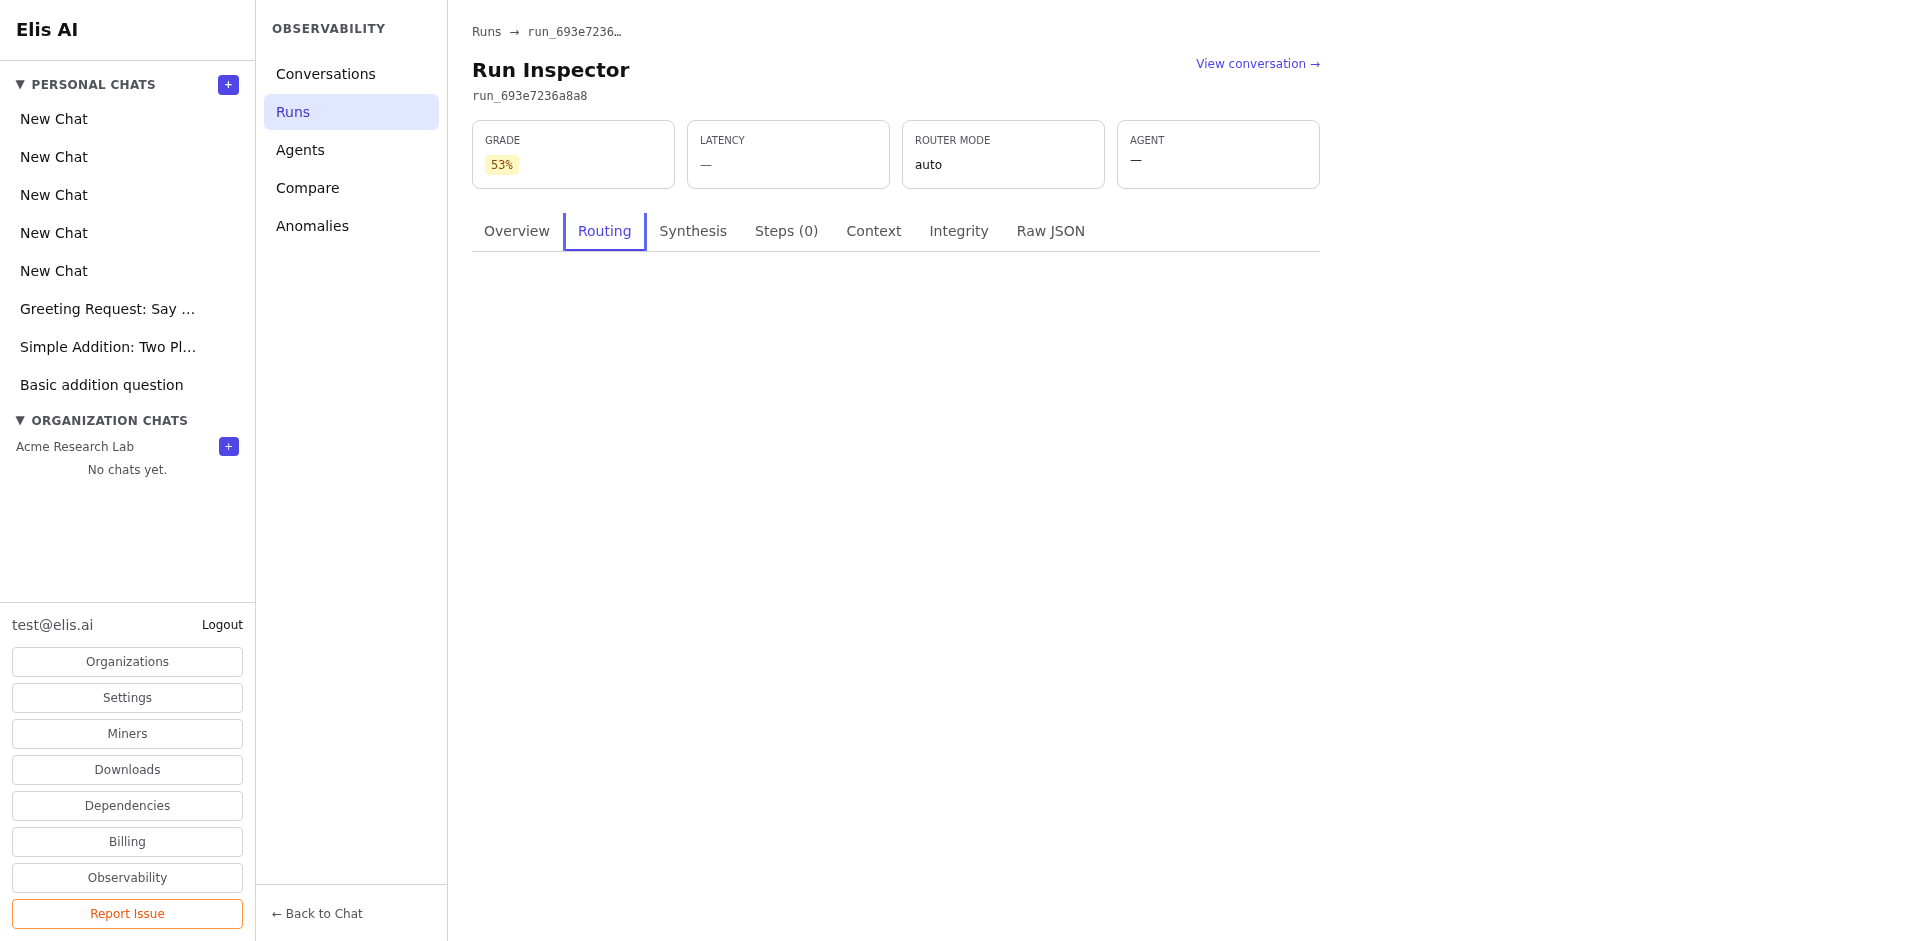
Explore the Routing tab
The Routing tab shows how the router chain selected the agent: similarity scores, candidate rankings, and the final decision rationale.
3
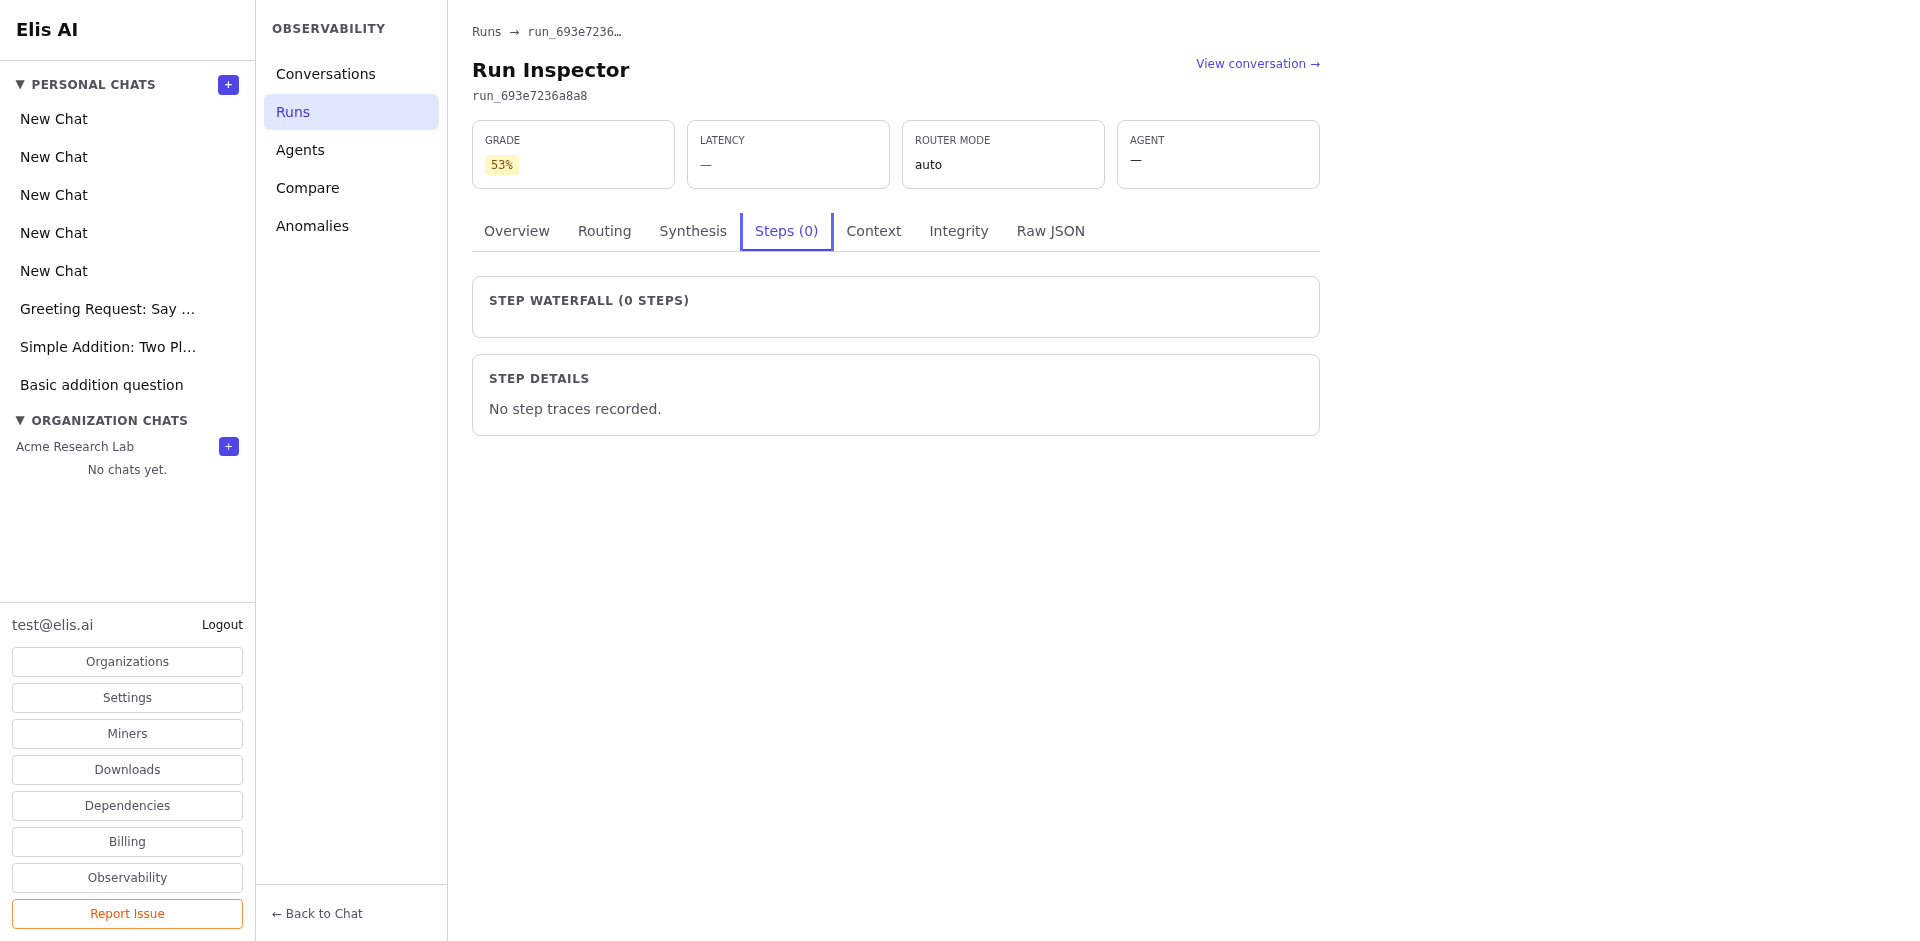
Review the Steps tab
The Steps tab lists every execution step in order: tool calls, model inferences, and intermediate outputs. Click any step to expand its full payload.
4
Check Context and Integrity
The Context tab shows retrieved documents and KB snippets. The Integrity tab surfaces any consensus mismatches or anomaly flags.
5
Raw JSON
The Raw JSON tab provides the full run packet for debugging or export. Use the copy button to grab it.
Tip:If a run scored poorly, start with the Routing tab to check if the right agent was selected, then drill into Steps to find where the execution went wrong.